SABIC, SLB, Baker Hughes, Honeywell, Halliburton and thirteen more companies run R&D centers here, alongside KFUPM's own research institutes. That density is DTV's pitch, and a brochure flattens it: no sense of who sits next to whom, how big each campus is, or where anyone actually is.
So every logo lands on its building.
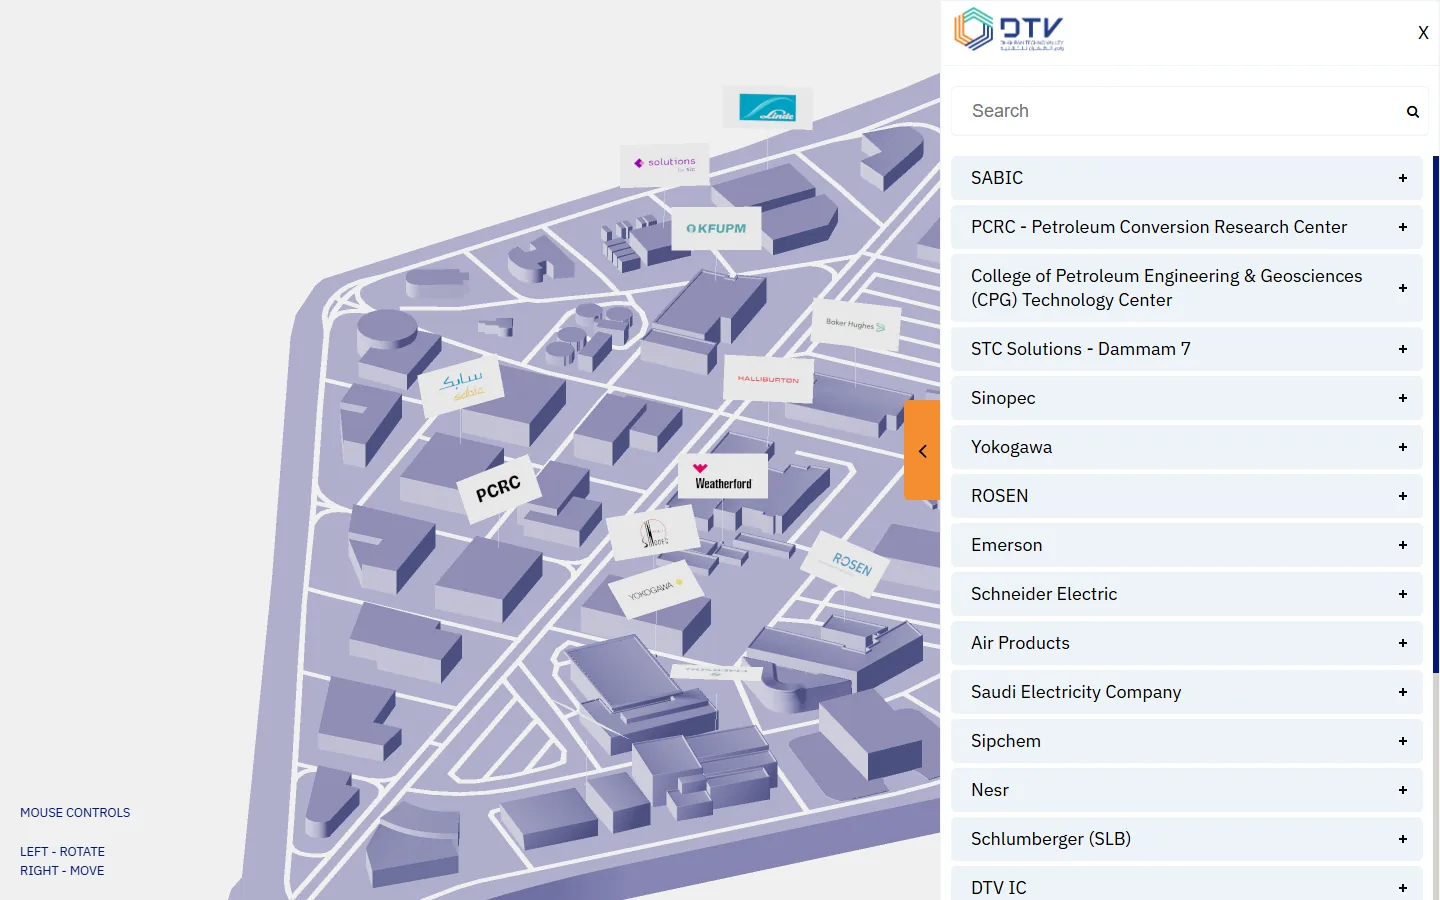
We rebuilt the valley as a real-time 3D model of its roads, plots and buildings, seen from an architect's isometric angle. Each logo floats over its own roof, so the overview explains itself.
One campus, one colour.
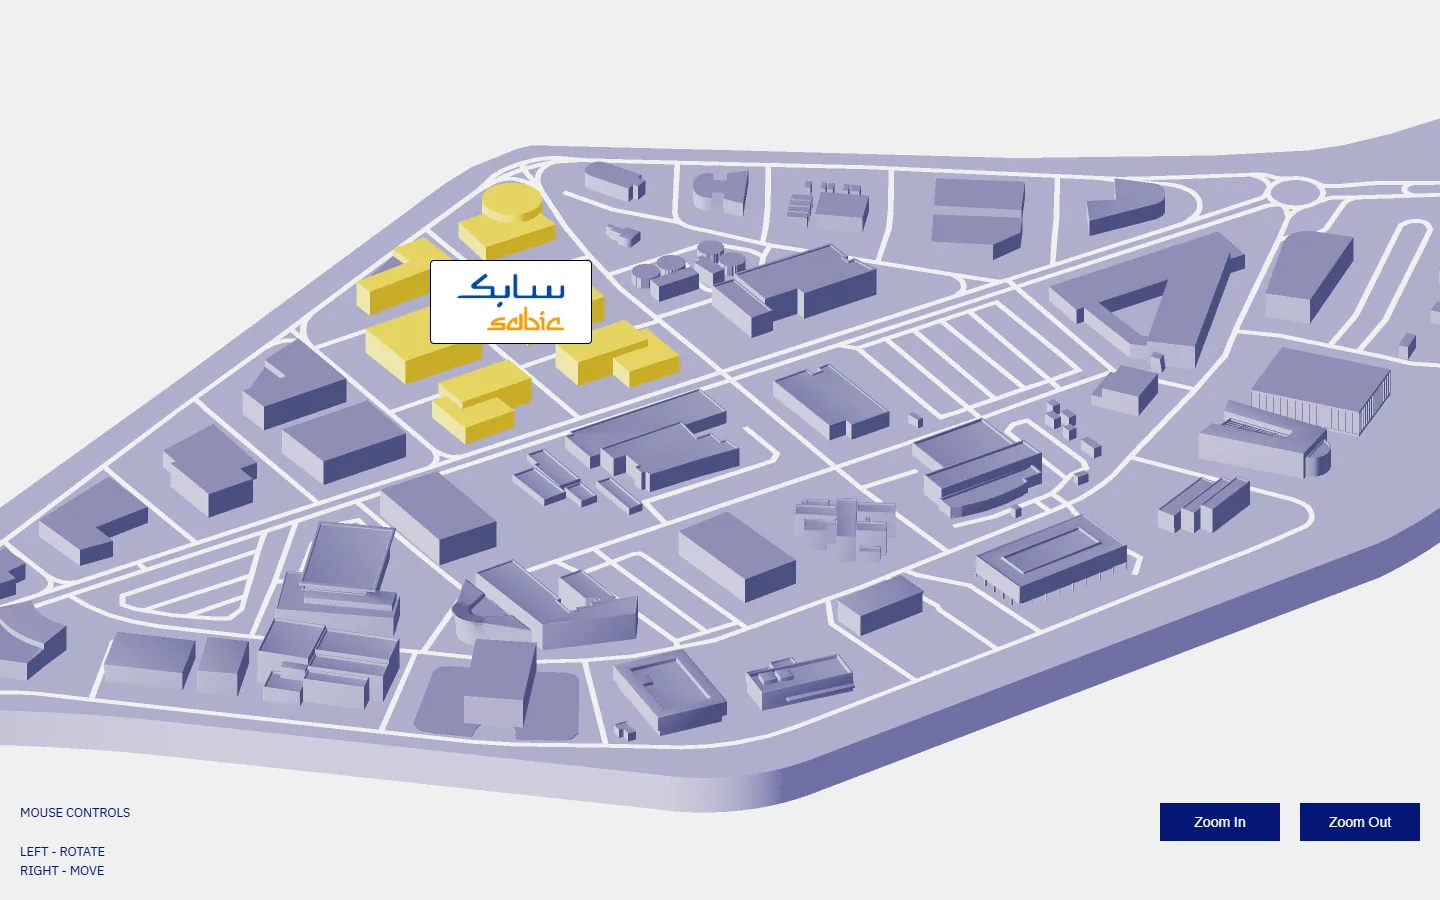
Point at a building and everything that tenant occupies lights up in its own brand colour. SABIC's Technology & Innovation Center is spread over several lots. On the map it reads as one.
Your turn.
Search a name or point at a building. Drag to turn the valley, right-drag to move it, Ctrl + scroll to zoom.Search a name or tap a building. One finger turns the valley, two fingers move and zoom it.
No tenant by that name. Try “SLB” or “KFUPM”.
Pick a tenant to see who they are and where they sit.
A Saudi chemical manufacturing company: 70% owned by Saudi Aramco and specialized in petrochemicals, chemicals, industrial polymers and fertilizers. It is the second largest public company in the Middle East and Saudi Arabia.
SABIC T&I Center in DTV SP is planned to support polymers, chemicals and materials in collaboration with university and other stakeholder.
PCRC is a KFUPM research center with primary mission to conduct interdisciplinary and transformative research in petroleum conversion and the sustainability of petroleum reserves. The center aims to bridge the gap between academic innovation and industrial application by developing and scaling up advanced technologies in the downstream oil and gas sector. The center’s research is organized into several key themes including Enhanced Refining, Chemicals & Petrochemicals, Polymers & Plastics, Renewable & Alternative Fuels, and Waste Recycling.
College of Petroleum Engineering & Geosciences (CPG) Technology Center
The College of Petroleum Engineering & Geosciences Technology Center (CPG-TC) is an integral element of the R&D continuum emphasized by the College of Petroleum Engineering & Geosciences (CPG). CPG-TC is an innovation hub where products of basic and applied research are pushed to the market. The center is living the CPG vision of being integrative and truly multidisciplinary. The unique technical facilities of the center and the fundamental results that they generate are to act as a catalyst for entrepreneurs to develop innovative solutions to contemporary problems that are pertinent to the upstream sector of the Oil & Gas Industry. The aim is to promote strong partnerships between industry and academia through research projects, joint ventures, startup-companies, and more in line with a knowledge-based economy.
Facilities available at CPG-TC include a collaborative learning environment, office and lab space, including state of the art laboratories in chemistry and physical sciences. A natural focus includes petroleum engineering and cutting-edge oil & gas technologies, though this is in no way limiting. Other technology areas of focus are remote sensing, GIS, and virtual reality applications, represented by our Remote Sensing Laboratory.
STC Solutions is the Kingdom’s leading provider of IT solutions providing innovative, integrated technology solutions to enterprises and Saudi society. The Dammam 7 supercomputer, developed in partnership between STC Solutions and Aramco. Located in Dhahran Techno Valley (DTV), this cutting-edge facility boasts a peak computing power of 55.4 petaflops, enabling it to process and image some of the world’s largest and most complex geophysical datasets.
Dammam 7 plays a pivotal role in advancing digital transformation within the energy sector. It supports Aramco’s upstream operations by enhancing exploration and development capabilities through sophisticated subsurface modeling and deep-learning algorithms. The facility exemplifies STC’s commitment to innovation and technological excellence, contributing significantly to Saudi Arabia’s leadership in geosciences and energy digitization.
Contact: Ali Faraj Al Salem - alalsalem@solutions.com.sa
SINOPEC (China Petrochemical Corporation) is a global leader in energy and chemical industries with headquarters in Beijing, China. As the largest oil refining company and the second-largest chemical company worldwide, SINOPEC has a presence in over 80 countries and its operations span the entire oil, gas and new energy value chain. Upholding the mission of providing cleaner energy for better life, SINOPEC is committed to building a world-leading clean energy and chemical company.
SINOPEC Middle East R&D Center, located in Dhahran Techno Valley, focuses on tackling key technical challenges in oil and gas exploration, petroleum engineering, refining, and new energy development for Saudi Arabia and the Middle East.
Yokogawa is a Japanese multinational company specializing in industrial automation and control, as well as test and measurement solutions. It provides a wide array of products and services, including distributed control systems, field instruments, and production control software to industries like oil and gas, power, chemicals, and pharmaceuticals. The company's goal is to improve the efficiency, safety, and reliability of industrial processes through its advanced technologies.
Yokogawa's commitment to the Kingdom of Saudi Arabia is demonstrated by its R&D center located in the Dhahran Techno Valley. This center is a key hub for innovation, particularly in developing technologies related to industrial automation and control. It plays a crucial role in supporting local industries like Saudi Aramco by offering technical expertise, specialized training, and localized R&D projects. The Dhahran center's work contributes directly to the Kingdom's Vision 2030 by focusing on knowledge transfer, technology localization, and the development of a skilled Saudi workforce.
ROSEN is a global technology company that provides a wide range of asset integrity management solutions, with a strong focus on the oil and gas industry. The company is known for its cutting-edge inline inspection tools, often called "smart pigs", which travel through pipelines to detect and characterize flaws like corrosion and cracks. Beyond inspection, ROSEN offers integrity engineering, data analysis, and software solutions to help customers ensure the safety and optimal performance of their assets.
In Dhahran Techno Valley (DTV), ROSEN has established a key facility that serves as a vital hub for its operations in the Middle East. This center is specifically designed to provide specialized field inspection services, data evaluation, and maintenance, which are crucial for the region's energy infrastructure. By localizing these services and deploying regionally assigned tools, the DTV center ensures a high level of operational efficiency and rapid response for its clients. The facility's presence supports local content initiatives and fosters collaboration with regional partners like Saudi Aramco.
Emerson is a global technology and engineering company that provides a wide range of solutions for industrial, commercial, and consumer markets. A leader in industrial automation, the company offers control systems, software, and measurement instruments that improve the efficiency, safety, and reliability of manufacturing processes. Emerson's business is split into two primary segments: Automation Solutions and Commercial & Residential Solutions, serving industries like oil and gas, power, chemicals, and food and beverage worldwide. It's a key provider of integrated technologies that help customers optimize operations and achieve digital transformation.
Emerson's center in the Dhahran Techno Valley (DTV) is a crucial hub for the company's regional operations and its commitment to Saudi Arabia. The facility serves as a technology and innovation center with collaboration spaces and laboratories dedicated to research and development in industrial automation and the Industrial Internet of Things (IIoT). By collaborating with local partners like Saudi Aramco and King Fahd University of Petroleum and Minerals (KFUPM), the center aims to localize technology and develop the skills of Saudi professionals. It's a significant investment that aligns with Saudi Vision 2030's goals of building a knowledge-based economy.
At Schneider Electric, we believe access to energy and digital infrastructure is a fundamental human right. Our mission is simple yet profound: empower everyone to maximize their energy potential and resources, ensuring Life Is On everywhere, for everyone, at every moment. We deliver integrated energy and automation solutions that drive both efficiency and sustainability across critical sectors, from smart homes and intelligent buildings to mission-critical data centers and industrial operations. By combining world-leading energy technologies with real-time automation, AI-driven software, and expert services, we create solutions that don't just power infrastructure, they transform it.
Schneider Electric's center at Dhahran Techno Valley (DTV) serves as our innovation hub for next-generation automation solutions. We harness the power of the EcoStruxure platform to co-innovate with customers, developing advanced control systems that address the global challenge of openness while delivering faster, smarter solutions specifically designed for the unique challenges facing Saudi Arabia and the broader Middle East region. Our team combines deep regional expertise with global innovation capabilities, creating customer-centric solutions that not only solve today's industrial automation challenges but also enable sustainable growth.
Air Products is a leading global industrial gases company with over 80 years of history. The company provides a wide range of essential industrial gases and related equipment to dozens of industries, including refining, chemicals, metals, electronics, food and beverage. Air Products is also a leader in developing and operating large-scale clean hydrogen projects that support the global energy transition and decarbonization efforts. With a strong focus on sustainability, the company aims to create innovative solutions that benefit the environment and help customers improve productivity and energy efficiency.
The Air Products Dhahran Technology Center, located in the Dhahran Techno Valley Science Park, serves as a cornerstone for the company's technology and project development in the Middle East. Opened in 2019, the center provides expertise to support new opportunities for industrial gases, with a focus on improving process safety, energy efficiency, and reliability for regional customers. It also serves as a hub for collaboration with regional universities and has been the site of significant projects, including the inauguration of Saudi Arabia's first hydrogen fueling station in partnership with Saudi Aramco.
Saudi Electricity Company (SEC) is the primary provider of electricity in Saudi Arabia, playing a vital role in the kingdom's development by generating, transmitting, and distributing electricity to all sectors. The company operates an extensive network across the country and is a leader in the Middle East and North Africa in power production. SEC is committed to adopting modern technologies and sustainable solutions to improve service quality, enhance energy efficiency, and meet the growing demand for electricity in alignment with Vision 2030.
SEC established a specialized research center in the Dhahran Techno Valley (DTV), a premier hub for energy innovation. The center, a result of a strategic agreement with DTV, focuses on research and scientific studies related to energy production, transmission, and distribution. It includes advanced laboratories and simulation equipment to develop new technologies, improve system reliability, and increase power production to keep pace with the Kingdom's rapid growth.
Saudi International Petrochemical Company (Sipchem), established in 1999, is a leading petrochemical manufacturer based in Al Khobar, Saudi Arabia. With a diverse portfolio of over 15 products, including methanol, butanediol, and vinyl acetate monomer, Sipchem operates in more than 100 countries worldwide. The company is committed to innovation, sustainability, and contributing to the Kingdom's Vision 2030 objectives.
Sipchem's state-of-the-art Research and Development Center is situated within the Dhahran Techno Valley Science Park, a hub for innovation managed by the Dhahran Techno Valley Holding Company (DTV), a subsidiary of King Fahd University of Petroleum and Minerals (KFUPM). The facility spans 15,000 square meters and houses 37 laboratories, along with various halls and auditoriums, fostering a collaborative environment for scientific advancement. This center underscores Sipchem's dedication to pioneering research in the petrochemical sector.
National Energy Services Reunited (NESR) is a leading oilfield services provider operating across the MENA and Asia-Pacific regions. As the first MENA-based energy services company listed on NASDAQ, NESR delivers a comprehensive range of production, drilling, and evaluation services while championing innovation, safety, and sustainability across the energy sector.
The NESR Oilfield Research & Innovation Center (NORI) at Dhahran Techno Valley is a LEED-certified, state-of-the-art facility designed to drive innovation and sustainable energy solutions. Integrating advanced laboratories, energy-efficient systems, solar power, water conservation, and green building design, NORI stands as a benchmark for sustainable construction and a hub for collaborative research in decarbonization, reservoir development, and operational intelligence.Contact: Nouf Altwaijiri - naltwaijri@nesr.com
SLB is a global technology company driving energy innovation for a balanced planet. At SLB our purpose is to create amazing technology that unlocks access to energy for the benefit of all. As innovators, that’s been our mission for 100 years. We are facing the world’s greatest balancing act—how to simultaneously reduce emissions while meeting the world’s growing energy demands. Our collective future depends on decarbonizing the fossil fuel industry while innovating across the entire energy landscape. With a global footprint in more than 100 countries and employees representing almost twice as many nationalities, we work each day on decarbonizing industry, innovating in oil and gas, delivering digital at scale, and developing and scaling new energy systems that accelerate the energy transition.
Since its opening in 2006, the Schlumberger Dhahran Carbonate Research (SDCR) center is executing R&D projects focused on addressing the needs of the GCC market, and especially of Saudi Arabia. Historically, the center’s main axis of research were along carbonate formations properties, petrophysics, rock and fluids mechanics. Nowadays, our main mission is to develop technologies that help maximize our customer’s oil and gas reserves and recovery, as well as to develop technologies aimed at improving the environmental footprint of our operations, such as de-carbonation and produced water treatment.
Innovation Cluster (IC) Building serves as a hub for innovation and technology transfer activities in DTV ecosystem. It supports the university's research and innovation strategy, focusing on multidisciplinary research and strategic partnerships to address national and global challenges. IC building houses one of the largest incubator spaces in the MENA region alongside co-working offices and laboratories for SMEs to operate their R&D activities. It also acts as the headquarters of DTV Holding Company (DTV), a subsidiary of KFUPM, established to foster a knowledge-based economy in Saudi Arabia. DTV provides strategic, business, and investment services to support technology transfer, entrepreneurship, and the growth of innovative companies and jobs.
Honeywell is a diversified technology and manufacturing company that develops solutions for aerospace, building technologies, performance materials, and safety and productivity. With a long history in Saudi Arabia spanning over seven decades, Honeywell is a key player in the Kingdom's industrial landscape. The company's work aligns with Vision 2030, focusing on localization, job creation, and contributing to a knowledge-based economy through its various businesses, including UOP and Process Solutions.
Honeywell's presence in Dhahran Techno Valley (DTV) includes a significant research and training center. The center provides a platform for engineering research and training for employees, customers, and partners, supporting new product development and technological advancement in the region. It also hosts collaborative research projects with prestigious institutions like King Fahd University of Petroleum and Minerals (KFUPM) and serves as a base for offering specialized training programs, including those for Honeywell's UOP business, which are crucial for enhancing local talent and skills in the oil and gas sector.
TAQA, or the Industrialization and Energy Services Company, is a Saudi Arabian joint stock company and a leading provider of integrated well solutions for the energy industry. Established in 2003, TAQA is a champion in delivering a wide range of products and services, including drilling, well completions, and intervention. It has a global footprint with operations in over 20 countries, enabling performance and sustainable business for its customers.
TAQA's Innovation Center located in the Dhahran Techno Valley serves as a hub for research and development, particularly for digital solutions, AI, and analytics, aligning with the Kingdom's Vision 2030. The company's facilities in the region also include operations and manufacturing bases that support its various well services. By localizing its supply chain and investing in R&D, TAQA is working to build a competitive and reliable local energy ecosystem.
Baker Hughes is a global energy technology company with operations in over 120 countries. They provide a diverse portfolio of equipment, services, and digital solutions across the energy and industrial value chain. The company focuses on making energy safer, cleaner, and more efficient for the world, with a strong emphasis on the energy transition through technologies in hydrogen, carbon capture, and geothermal energy.
The Baker Hughes Dhahran Technology Center is a key regional hub, strategically located at Dhahran Techno Valley. This state-of-the-art facility is a center for research and development, providing advanced technologies and services tailored to the needs of the Middle East. It houses technologies like metal 3D printing and digital visualization platforms, which help optimize and simulate well operations. The center also plays a crucial role in localizing expertise and supporting Saudi Arabia's Vision 2030 through job creation.
Halliburton is a leading global company that provides a wide range of products and services to the upstream energy industry. With operations in over 70 countries, it focuses on assisting customers throughout the lifecycle of oil and gas reservoirs, from exploration and drilling to completion and production. The company is recognized for its technological innovations, including solutions for hydraulic fracturing, and it operates through two main segments: Completion and Production, and Drilling and Evaluation.
The company's presence in Saudi Arabia is highlighted by the Halliburton Dhahran Unconventional and Reservoir Productivity Technology Center, located in Dhahran Techno-Valley. This center serves as a key hub for research and development, providing state-of-the-art solutions for conventional and unconventional reservoirs, both within the Kingdom and the wider region. It facilitates collaboration between Halliburton scientists, Saudi Aramco, and researchers from King Fahd University of Petroleum and Minerals (KFUPM). The center's mission is to develop localized technology and expertise, supporting the Kingdom's vision for a knowledge-based economy and contributing to local employment and training opportunities.
Weatherford is a leading multinational oilfield service company that provides a wide range of innovative solutions, technologies, and services to the oil and gas industry. The company's operations span the entire lifecycle of a well, from drilling and evaluation to completion, production, and intervention.
Weatherford’s Dhahran Techno Valley (DTV) Center serves as a strategic hub for research, development, and innovation, advancing next-generation oilfield technologies to support Saudi Arabia’s energy sector. The center delivers pioneering solutions across production, completions, chemicals, and digital domains, with R&D activities fully aligned to the Kingdom’s technology priorities.
Collaboration is at the core of the DTV Center’s mission. Weatherford partners with leading Saudi universities, including KFUPM and KAUST, to drive fundamental research, foster innovation, and develop the next generation of technical talent. The center also plays a vital role in supporting the Kingdom’s localization objectives. Weatherford emphasizes building strategic supplier partnerships, expanding in-Kingdom manufacturing capabilities, and accelerating knowledge transfer through advanced training programs. Through these initiatives, Weatherford’s DTV Center stands as a key contributor to the Kingdom’s energy technology ecosystem and a catalyst for sustainable innovation and long-term industry growth.
Linde is a leading global industrial gases and engineering company with sales of $33 billion in 2024. We live on our mission of making our world more productive every day by providing high-quality solutions, technologies and services which are making our customers more successful and helping to sustain, decarbonize and protect our planet. The company serves a variety of end markets such as chemicals & energy, food & beverage, electronics, healthcare, manufacturing, metals and mining. Linde's industrial gases and technologies are used in countless applications including production of clean hydrogen and carbon capture systems critical to the energy transition, life-saving medical oxygen and high-purity & specialty gases for electronics. Linde also delivers state-of-the-art gas processing solutions, efficiency improvements and emissions reductions.
Linde's R&D Center in DTV is focused on developing new CCS technologies and optimizing carbon capture, transport, and storage processes for Saudi Arabia. The center's innovative design has been finalized, reflecting Linde's commitment to energy efficiency.
Visitors, investors and prospective tenants can explore the park on their own. These are the screens DTVC shipped.
dtv.sa/interactive-map
3D valley model
Roads, plots and buildings modelled in detail and rendered live in WebGL.
Logo flags
Every tenant's logo floats above its roof, so the overview reads at a glance.
Brand-colour highlighting
Hover a building and everything that tenant occupies lights up in its own colour.
Tenant directory
All 21 tenants in a sidebar, each with a profile: logo, what they do at DTV, website.
Live search
The directory narrows as you type. One letter at a time, down to one name.
Linked list and map
Pick a name in the list and the map shows you where it is.
Homepage mode
One URL switch strips the map down for the DTVC homepage: zoom buttons, keyboard zoom, logo tooltips.
Guided intro
A branded loader counts the real download, then a camera move brings the valley in.
The live map: the 3D valley with logo flags and the tenant directory
Homepage mode: SABIC's lots highlighted in its brand colour, with its logo in a tooltip and zoom buttons below
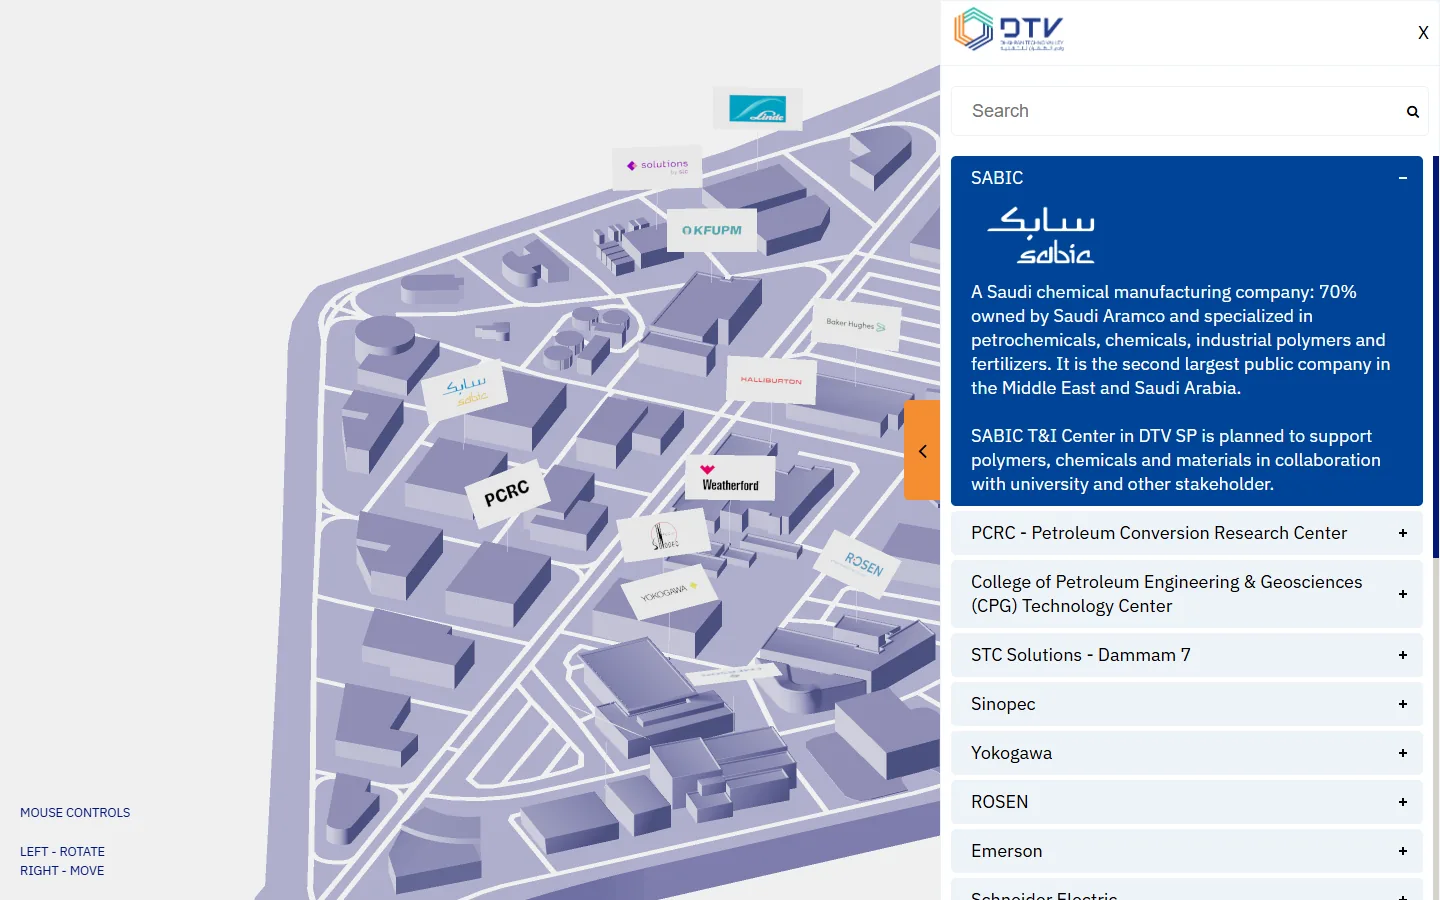
SABIC selected in the directory: its profile card with logo and description
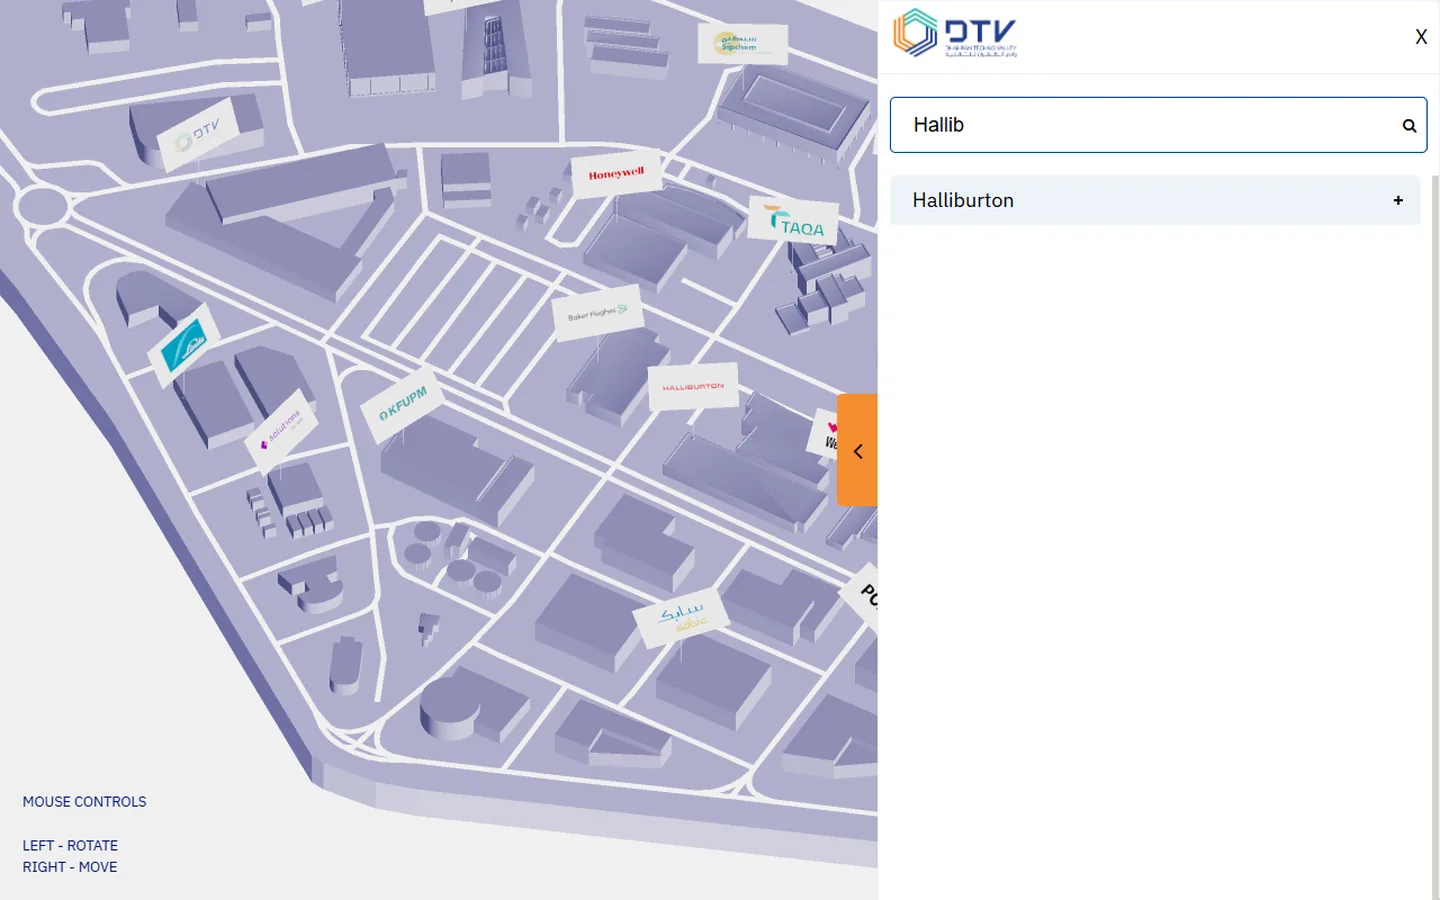
Live search: typing "Hallib" narrows the directory to Halliburton
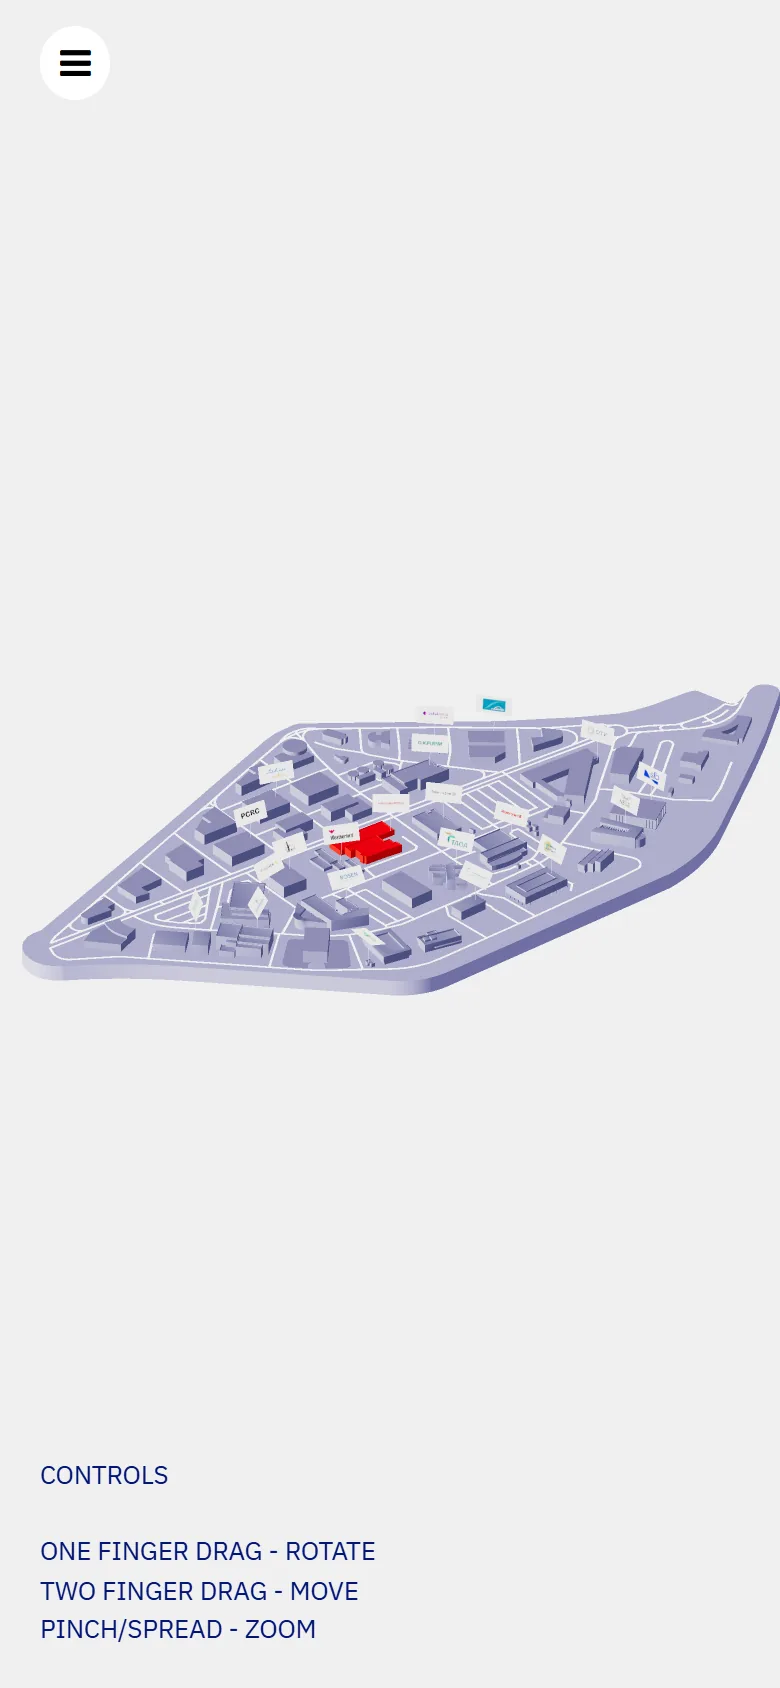
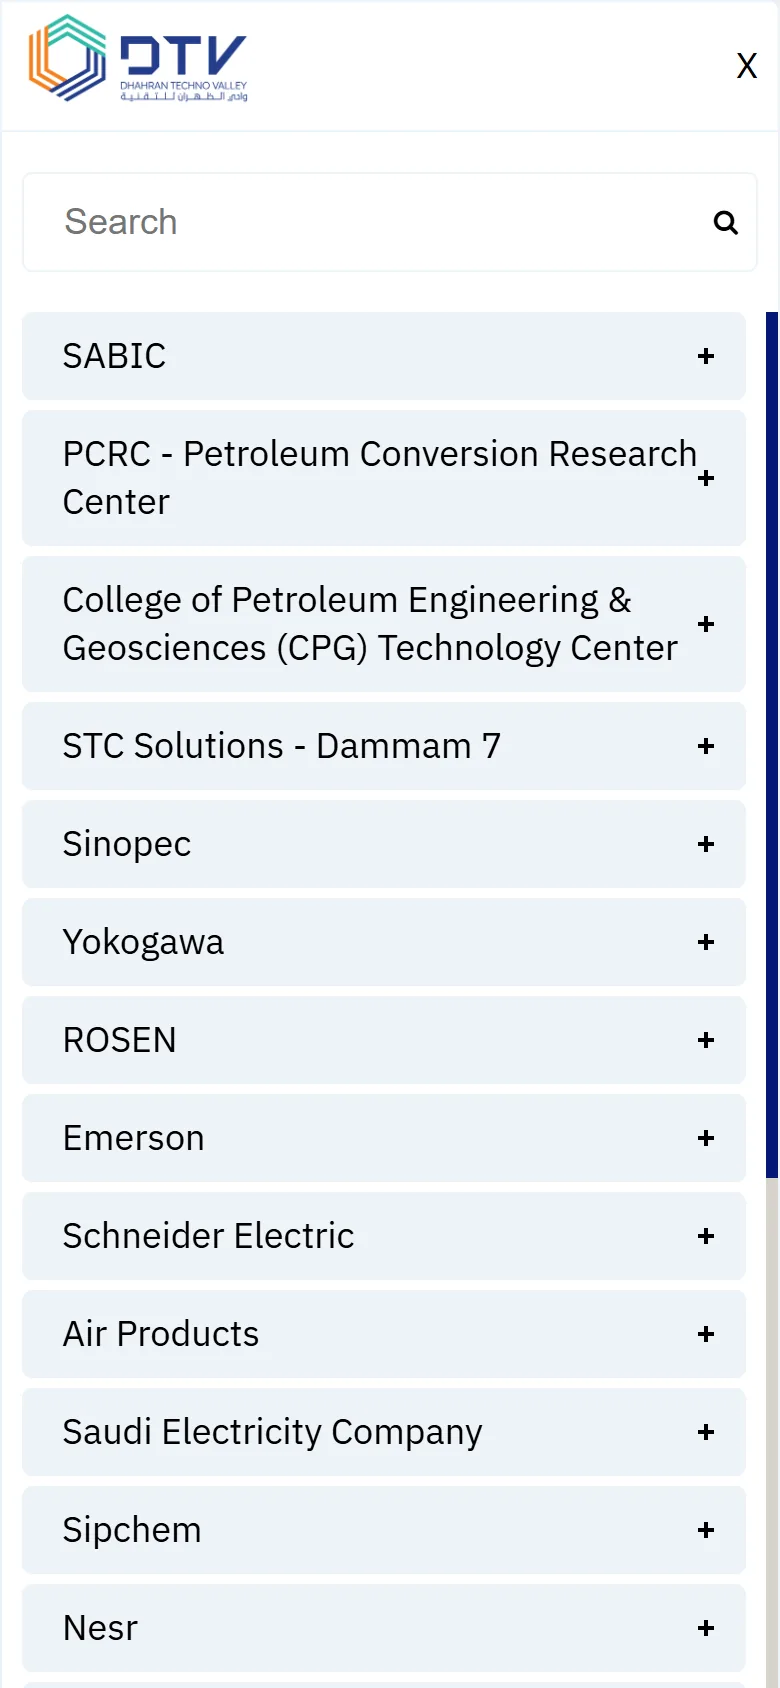
The whole valley in viewThe directory, full screen, with search
Mouse or thumb, it just works.
The map fills the screen and the controls follow the input. On phones the directory slides in behind a menu button and search works exactly the same. A short legend in the corner means nobody has to guess.
Map controls by device
Action
Desktop
Touch
Turn
Left drag
One finger
Move
Right drag
Two fingers
Zoom
Scroll wheel
Pinch
Built for the homepage too.
Add ?mode=home to the URL and the same codebase becomes an embed for the DTVC website. The sidebar goes and scroll-wheel zoom switches off, so the page still scrolls. Zoom buttons and +/− take over, and a click shows the tenant's logo.
What it looks like, who is there and what they do. Visitors explore DTV themselves instead of reading a brochure.
One source of truth
Names, logos, descriptions, brand colours and the buildings each tenant occupies live in one data file. A new tenant is a data change and a logo, not new code.
Works anywhere
Any modern browser, desktop or mobile. No app, no plugin, nothing to install.
Reusable on the website
The same codebase powers the full map and the homepage embed.
Every tenant in its own colours
Highlights use each company's brand colour, so partners recognise themselves on the map.
How it's built.
Stack
Technology stack
Rendering
Three.js (WebGL), orthographic camera, orbit controls with damping
Animation
GSAP timelines for the loader fade and the intro camera move
3D assets
One glTF binary (.glb) model of the valley
Build
Vite for the dev server and production bundle, Sass for styles
UI
Vanilla JavaScript for the sidebar, search, tooltips and zoom
Content stays out of the renderer
Each tenant is one entry in a data file. Every frame, a raycaster casts from the pointer into the scene. When the nearest hit is one of a tenant's meshes, all of that tenant's meshes take its brand colour. Designers update the model and editors update the descriptions, and neither touches the rendering code.
We use analytics cookies (Google Analytics) only with your consent to improve our services.
You can accept or reject non-essential cookies. Please read our
Privacy Policy.